
I discussed my analytics philosophy in Part 1. In order to follow along, let’s work through connecting all of your data sources together.
First, the two sources nearly everyone reading will have: user-tracking analytics, and a production database. Today I’m going to discuss how we’re handling this at OneMonth. The core of the heavy lifting is handled by Segment, Fivetran, and Zapier.
Unlock your data
In many cases, user tracking data is locked inside Kissmetrics, Mixpanel, or google analytics. I’m sure that I’m not the only analytics guy who has looked at Mixpanel, and thought to myself, if only I had access to this raw event stream, I could do something way more insightful! Luckily for me, One Month was already using a rock solid Segment.com integration to send these user events all over the place, and segment is the key here.
I mentioned segment.com as the one tool to rule them all, and I think they’re doing a really amazing job simplifying the event-tracking side of analytics. One of their great new-ish features they call segment SQL. Because segment doesn’t really care where your data goes, they want you to have as much access to it as possible – unlike MP, KM, or GA who have a vested interest in keeping you locked into their particular platform (sorry guys, you know I like you, but this is a huge annoyance). This led them to enable access to the raw event data IN AMAZON REDSHIFT. Boom. Now, we have query-access to the raw event stream. In my experience this is by FAR the most straightforward and scalable way to have access to your user events.
The segment business plan that enables this is relatively expensive, but it’s the easiest path. That said, they also just released Segment Warehouses last week in order to enable less expensive options to the raw data that require less overhead on their side (and conceivably could enable better data security), but will require some internal dev time on your side to maintain. For One Month, the convenience factor won the day, but your mileage may vary.
Next, I had planned to use Zapier and some custom code in order to connect the production database, zendesk, stripe, surveys, and hubspot to the redshift database. I’m particularly excited to see the effect of customer success teams – and zendesk data – on onboarding and paid conversion rates. CS teams can be a big competitive advantage, and being able to prove their value could cement their place.
Data-pipeline-as-a-service
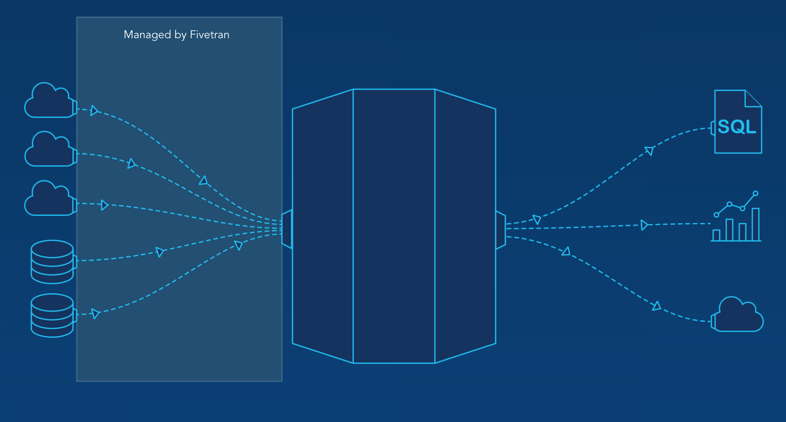
However, even as we work on these types of projects, new tools are coming out. Data-pipeline-as-a-service is a new niche that several companies are spinning up solutions for. Some names here are RJMetrics and Fivetran. For OneMonth, we chose Fivetran. They were suggested to us by the chart.io guys during a demo, and it’s a pretty slick tool. Instead of having to come up with a schema and write up the zap for each event, they automated all of that interaction and made it pretty close to a one click setup to send everything to redshift. They’re still in a very early stage, so one of our integrations had some bugs, but they had everything straightened out within 24 hours.
Once they did, zendesk, stripe, and hubspot were auto-magically populated into our segmentSQL redshift instance. This saved me a bunch of setup time, and also populated all of the fields. If I had to write up the schema myself, I was going to only take what I considered to be the most important fields, but now, I get everything. Plus, we’re excited that someone else will be managing those interactions. One Month runs quite light on developers, so offloading management to third party tools is an obvious win. In the time since I wrote the draft until publication, Fivetran has more than doubled the number of sources that they integrate with. Nice job guys – keep up the good work.
I also don’t want to leave Zapier out of this party – I did end up using them for our survey data. The answers already lived in a master google doc, and it’s a spreadsheet. Sending that data one line at time via zaps to redshift was quite straightforward. There will likely continue to be use cases where their simple app-to-app integrations are the best solution.
So, what did all of this buy us? In short, all of our data sources live in the same place and can be queried against each other. Mixpanel alone offers you the opportunity use funnels to ask “what % of people took action A, then action B, then action C?” That’s great, but it gives no context around the time intervals between events. Someone who took 24 hours to get all the way to Action C is a completely different type of user than someone who completed A, then B a week later, then C a week after that. One of my first data new visuals will be the time distributions of these event funnels.
Add a splash of history
But wait, there’s more! I know there are hack-y ways to adhoc this type of analysis, but since it’s in SQL, we can mix in a bunch of other data sources like the historical survey data where we define customer personas, and stripe! Does a certain type of person gorge on content while others consume at a more leisurely pace? Does that distribution change for people on a cheap plan versus an expensive plan? What impact does the type of distribution have on lifetime customer value? These are all ridiculously important questions that can have a material impact on your marketing, persona targets, and goals for your users.
Without Segment SQL and a data warehouse, we’re stuck with “X% of users completed action B”, but with it, we can learn so much more.
Best of luck connecting all of your data sources! Check back for the discussion of visualization tools to best analyze your new data warehouse, and a sample of some things we did at OneMonth.
[…] advanced analytics part 1 and part 2, we now have an amazing dataset to work with, where all of our data sources have now been put into […]
[…] will follow over Part 2 and Part 3 is a case study of an implementation of a new analytics setup that I hope will encourage […]