
In a data-driven organization, setting metrics and Key Performance Indicators (KPIs) help drive your business forward. While knowing various metrics about your business can help you in different ways, I’m a big proponent of the Lean Analytics concept of One Metric That Matters (OMTM). A savvy entrepreneur (and hopefully, the entire team) will know at any given moment what the most important metric to them happens to be at that moment. With this type of singular focus, you can drive meaningful change to your business without suffering from data paralysis.
An organization’s OMTM can and should change depending on the stage of the company, the short-mid term goals that you’re trying to achieve, and the type of business that you’re in. During my time at Speek, we changed our core metric a couple of times when our goals or strategy changed, and at Sestra, we know exactly what our focus is for the short term. Today I’m going to walk through how we landed on each of these metrics and how they impacted the business.
Speek’s Early Days: Registered Users
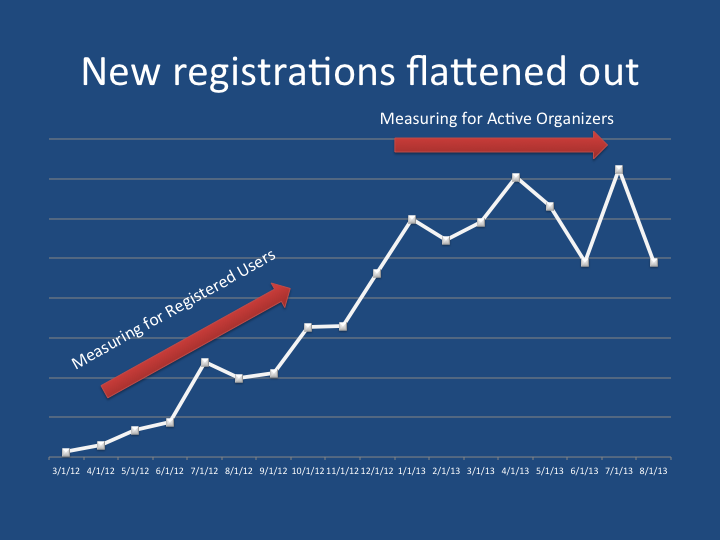
First, let’s talk about the early days. I wasn’t with Speek at the very beginning, but looking back at the data from that time period, and talking with the people who were there, it’s pretty clear that the goal was very much top-of-the-funnel. We were positioned as a B2C product with a friendly brand and we were looking for registered users. The team focused heavily on marketing and optimizing the signup process in order to encourage users to try us out. The biggest giveaway here is that we were measuring campaign effectiveness in terms of cost-per-registration.
Classically, you want to look at some number further along the line, but let’s be realistic here. How are you supposed to test any theory or figure out what’s working and what’s not when you don’t have any users? How can you measure a loyal user acquisition if you’ve only been around 6 months and half of your users are from the last 6 weeks. You have to make SOME assumption about certain types of users being better or worse than others, and basing your earliest days on “all users look alike – so let’s acquire registrations as cheaply as possible” is not the worst way to go. It’s crucial though not to mistake a shortcut in the early days for what you should be doing in an ongoing manner.
Registered Users:
–Easy to Measure
–Cheap to Acquire
–What else are you going to use when you don’t know what’s important
–Not ideal, but not terrible
Phase 2: Active organizers
As the company grew and users churned off or stuck around, we started to have more actionable data around user loyalty and usage. This was around the time that I started, and one of my first projects was a deep dive on our marketing spend from a loyal-user acquisition stand point. The biggest takeaway was that one of the best acquisition sources based on a cost per registered user metric had one of the highest churn rate of any source. This helped us realize that it was time to move to a more robust OMTM, but we certainly wish that we had migrated sooner.
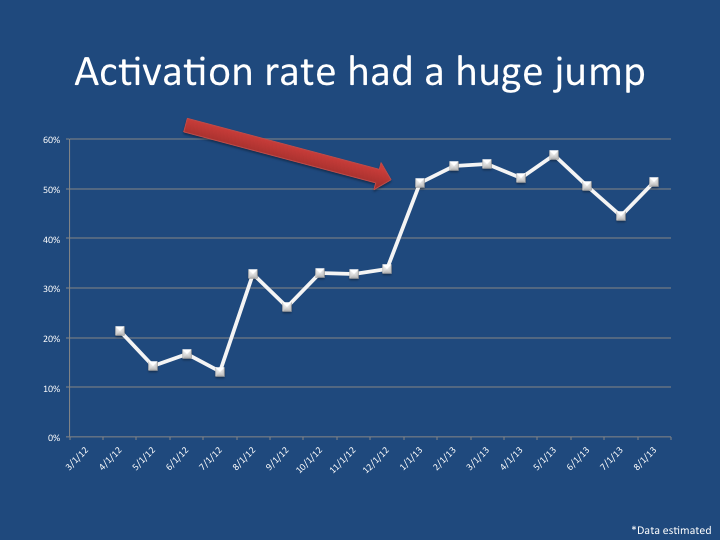
After some more data digging around our best users, we shifted our focus to the concept of an Active Organizer. This type of user is someone who has hosted at least one call with at least one other person. That gives us the opportunity for a viral interaction, and shows someone who is actually using the product. Sure, it still has some drawbacks like not distinguishing tire kickers, but it’s a much better indicator of growth: these people are showing speek to someone else and are many, many times more likely to pay.
Active Organizers / Active Users
–Much more meaningful indicator
–Create Viral Growth
–Still thinking of B2C, but encouraged the transition to B2B
In a textbook case of “you get what you measure for” our new registrations dropped 30-40% mostly losing paid acquisitions who didn’t convert anyway, and bumped our activation rate by almost 100%.
Again, we made product and marketing decisions based on this metric. For example a scheduling widget enabling people to invite another person or spending marketing dollars on another salesperson since the salespeople inherently pull someone onto a call with 2 people.
Best Fit: B2b Sales Demos
This leads me to phase 3, where we really saw success. Our number 1 leading indicator of revenue was number of sales demos set. The product/marketing/word of mouth generate inbound leads, and we made substantial improvements geared towards generating even more inbound leads in our subsequent releases. We even shifted our onboarding from a freemium model to a free trial model, to help turn all of those free registrations that we get into true sales leads.
Additionally, we worked the predictable revenue model of setting outbound sales demos. These inbound and outbound sales demos are just two sides of the same coin working to increase the number of demos that we set. And so when you asked me up through the time of Speek’s Acquisition, “what is your One Metric?”, my answer was sales demos.
Sales Demos
–Best indicator of future revenue
–Drove switch to a free-trial model and away from freemium
Make sure your One Metric Keeps up
Each adjustment to the One Metric was driven by the needs of the company at the time. When you’re deciding on your one metric, be sure to keep in mind your company stage, needs, and business model. Those can all change and your OMTM may change along with it!
What’s the One Metric That Matters for your business?