The Power of Habit is the first book that I started taking notes on for my new quick hits blog section. I hope you enjoy some key takeaways and inspiration drawn from the books that I’m recommending!
Premise: Habits are comprised of trigger, action and reward
Power of Habit definitely inspired me to reconsider some of the ways that I think about habit building. The book proposes that every habit is made up of a trigger, action, and reward. In order to develop habits (or change old ones), you need to understand what the trigger is that’s causing the habit, the action (or habit), and the reward that you get from it. This framework has absolutely helped me work to develop some new habits.
Key Takeaway: Daily Habits are powerful
The key change that it drove for me was proposing daily, morning habits. The reason that morning habits can be so powerful and effective is that the trigger – waking up – happens everyday. Most other habits revolve around triggers that happen most days, but nothing is as reliable as the action of waking up in the morning. This is one reason that habits – good or bad – can be hard to maintain when you have a change to your daily routines. If you start bad habits when you wake up, they’re going to stick and affect you every single day. But, if you trigger a good habit, you can make a ton of positive progress in whatever facet of your life you want to work on.
Plus, because of the concept of keystone habits, building a single good habit can often snowball into multiple others. I can see this happening for me, since last year, Lindsey and I started walking 10,000 steps every day. By building that one habit into our life, it has helped to show what else we can accomplish!
Hopeful Impact: 1 year of Blogging and Exercise
This year, Lindsey and I decided to wake up 30 minutes earlier everyday in order to accomplish some personal goal of ours. For me, that has meant exercise and writing for my blog. It’s unlikely that I would have been able to do either of these every single day – which is the point of using the morning as a trigger – so we setup the same time block and just alternate between the two. I either do 30 minutes of writing, or 30 minutes of exercise every morning. Additionally, to minimize decision making when it’s early and I’m groggy or unmotivated, I’m sure to decide the night before which of these I’m going to do. In general, I just alternate, but if there’s a good reason to do one over the other, I make sure to decide that the night before.
If you think that you might benefit from some of these lessons, I definitely recommend picking it up:
As the data person at a small, data-driven company, you can get roped in to measuring things in fields that aren’t your speciality. Sales, marketing, content, UX / product, growth, finance, and more all have measurable aspects that you might be called upon to analyze. This is great for you and the company, since you get a chance to learn about other aspects of the organization and guide your team with data driven decisions, even if your background in the field is on the weak side.
For example, before working at a startup, I would not have considered myself to be a “marketing person”. I think that’s likely typical for an analyst, since so many of us come from math or finance backgrounds. At a startup, though, marketing is a key opportunity for analytics to shine.
1) Marketing
Content Marketing. Moz, Hubspot, and others have really amazing guides to content marketing, and if you’re developing strategy, you should absolutely read them. The key applications of analytics, for me, follow here:
Every piece of content has a measurable goal. Lead magnets are trying to generate email addresses. Blog posts and infographics might be trying to just generate website traffic, comments, or backlinks. A sales support explainer video or ebook could be focused on increasing sales conversion rate. The important point for you is to make sure that the team decides, before generating content, what the goal for that piece is.
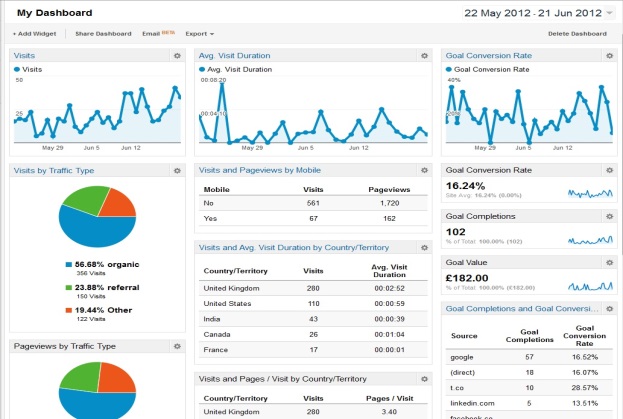
On a regular basis you, as the analyst, can help setup reporting that shows how each piece of content is achieving its set goal. Once you start to notice trends about which pieces are performing well with your specific audience, you’ll know where to focus your future efforts. This allows your marketing team to make the most of your small early marketing budget.
Paid Marketing Analytics. In addition to content, some companies will want to see an ROI calculation for essentially every dollar of marketing spend. You can help the marketing team prove the value of their efforts. GA, Facebook Ads, Google Ads, and other tools all have ways of attributing conversion events to appropriate customer touchpoints. Be careful to understand the difference between first touch, last touch, and various multi-touch attribution models, since different tools will give you different calculations. One of your biggest value adds can be understanding the differences in models, and deciding which model make sense to use or creating your own. For example, where is your team struggling the most? If it’s general awareness, perhaps focus on first touch success. If it’s conversion rates, multi-touch or last touch might be more important.
While paid marketing analytics are often the direct responsibility of the marketing team, a good analyst can always help deliver more results for the same spend.
2) Recruiting / HR Analytics
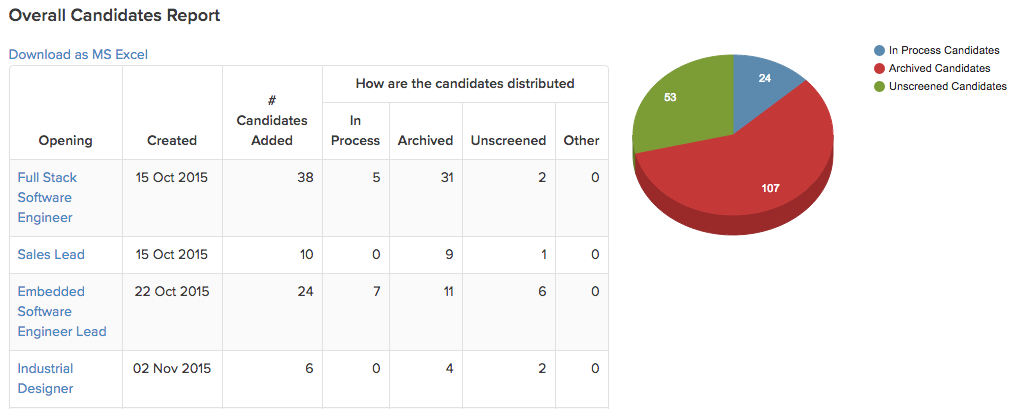
Recruiting is one of the key functions of any startup and much of this responsibility falls heavily on the founder, especially in the early days. In order to help her make the most of limited time, an analyst can look at the sources of your most successful candidates. Is a certain website leading to lots of candidates? Are some recruiting events or job boards just a waste of time and money? Is it worth paying a recruiter? What if you consider the value of the time that someone else is spending on recruiting? An applicant tracking system like greenhouse or workable can be a big help here, but in the early days you might not need one. Keep in mind though, that this is one of those areas where dollars and data isn’t always going to be a final decision-maker, since the value of having the founder pitch the job is sort of incalculable. That said, you should at least be aware of the tradeoffs that your team is making in terms of time and money in recruiting and HR!
3) Financial Metrics
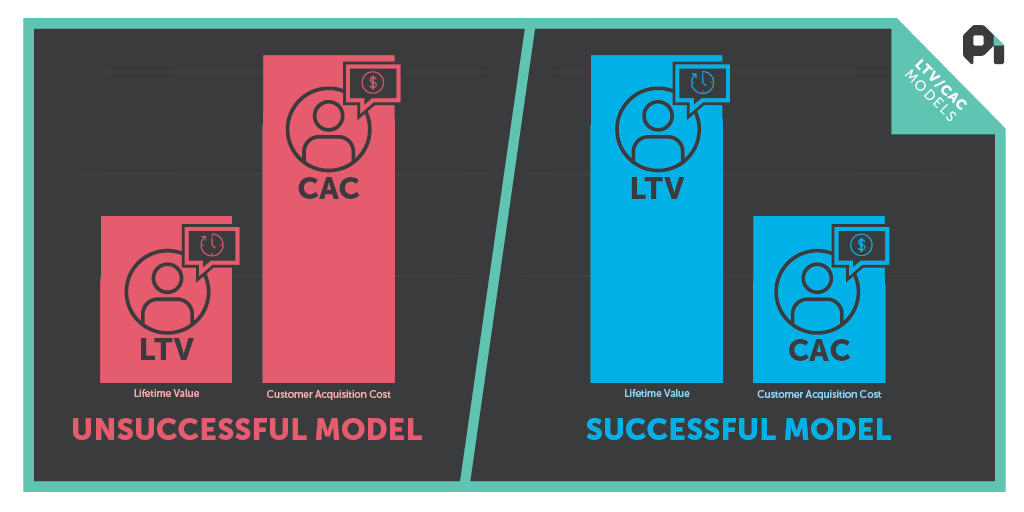
If you don’t come from a math or finance background, this area could be more of a challenge for you. If you started in accounting, maybe it won’t be a struggle at all. The financial metrics of cost to acquire a customer (CAC) and lifetime value (LTV) are at the heart of running a successful business, especially in the SaaS world. Churn, cash flow, and your sales funnel can be the difference between a successful business and running out of cash.
Depending on your founding team, they may have a strong handle on the core numbers, via direct calculation or intuition. However, if you have a super product-driven or engineering-focused early team, they may not even know the definitions of these metrics, let alone their values for the business. Make sure that if you don’t have a finance department, you at least begin to measure these important metrics, and go read this amazing SaaS metrics guide, or the equivalent if you’re running something other than a SaaS business.
4) Product / UX / Growth
The user experience of a web or mobile app might have been designed by a product person, an engineer, or a business person. Depending on who designed it, there will likely be different areas in need of improvement. Lucky for us, an analyst can work on testing all of it! You could help lead the charge for a sustainable experimentation and testing process to make your product more successful.
Use data and experimentation to help find your app’s magic moment. Then, use a growth process to encourage more users to reach that moment. I’ve written in other places more about how I would use analytics to start along this process, but it’s important to realize that even if you don’t have a product background, you can be helpful here. You can learn UX best practices so that your experiments are more likely to be successful, plus, you can get started on the process by gathering ideas from others on your team. It’s not important that you come up with the idea for every test; rather, you want to encourage the team to run tests, analyze the data, and promote the highest performing variations within the organization and the application.
What other fields have you worked in using data to drive decision making?
When you’re working in analytics, telling a story can be as important as the actual data behind it. Your analytical insights are only as good as the actions that you can take from them, and persuasive presentations are at the core of convincing business people to act. I realize that sounds cliche, but it’s true. Without effective presentation skills, an analyst’s job is incomplete.
At MITRE and at Sestra, I’ve worked with some great engineers, but they have a tendency to put WAY too much information on their slides and to get lost behind the language there. It’s always surprising to me to discover how little education many people receive around effective presentations. I feel lucky that my grad school program focused on these skills, and I draw from some of it’s lessons below.
The most prominent example of this lack of presentation education I experienced was at MITRE when one of the smartest folks on my team presented results of work that he had done. He’s a terrific engineer and was doing brilliant work. However, the presentation was one of the dullest that I’ve ever been in attendance for. Every slide had paragraphs of text, and he mostly read them to us. For 45 minutes. I was even on the more technical side of the audience, and I couldn’t understand most of the terminology. It was a disaster.
To avoid a situation like that, here are 5 quick things to remember when you’re compiling your next presentation.
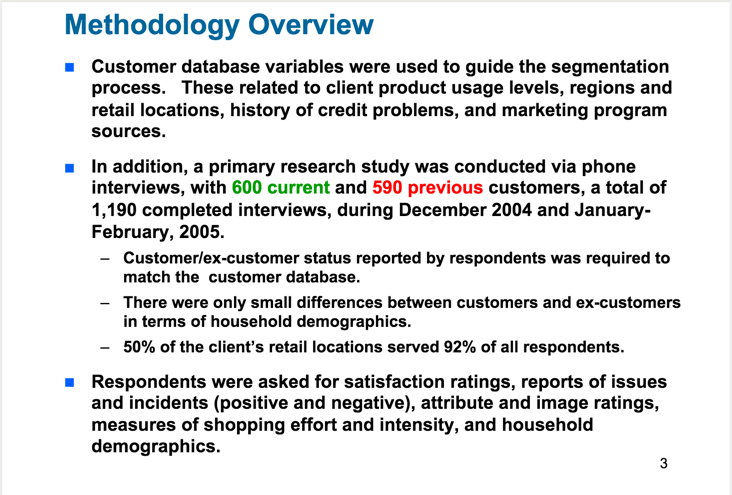
1) WIIFTA – What’s in it for the audience? – Remember that you’re not giving the presentation for you. It’s for the people who are listening. A typical example of a WIIFTA consideration could be a detailed methodology slide. This slide is important to you – it’s a clever new twist on an analytics technique and without you, your company would never have thought of it. But it’s not about you.
Consider your audience:
In a context where you are presenting your findings to a room full of data scientists looking to learn the latest language or technique, this slide would be absolutely appropriate. It’s a clever new way to look at something and this group wants to learn about it. However, in a context where you’re presenting the conclusions of your research to your company’s executives, it’s likely that this slide should minimized or removed completely, because this group doesn’t care. They likely trust that you’ve found a good solution, however you got there, and they just want to know why they should make a certain decision.
Oy, the following slide has some other issues (which we’ll revisit later), but if your audience demands a methodology slide, fine, include one. But if you include this slide when presenting to your boss, you’ve probably already lost her (and this is only slide 3!).
Show this slide to the wrong crowd, and they’re already bored of you.
2) BLUF – Bottom Line Up Front. – For most young analysts, this is the single biggest change to your presenting skill set that you can make. Oftentimes, an analyst wants to lay out a bunch of evidence and allow it to walk the audience to a conclusion. This is how your research worked, and it feels like the right way to structure your findings and to tell the story, too. It is not. In a business context, the audience wants to know exactly what they are listening for immediately. This goes for a presentation as a whole, along with individual sections or slides.
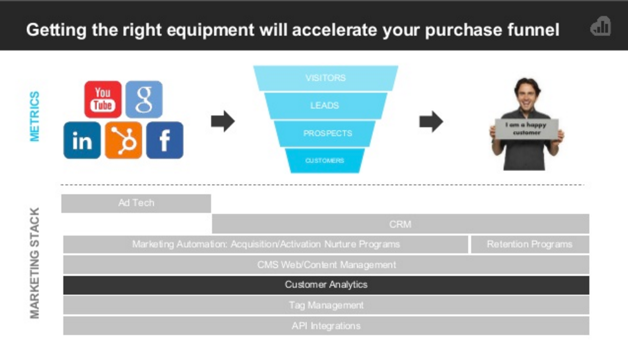
Check out this slide from kissmetrics. Even at 10% size, you know exactly what the slide is about. Well done. Most analysts writing this slide would have made the header “Equipment Choices” or some equivalent, but it is so much nicer to know exactly what conclusion you are supposed to draw right away.
I know exactly what conclusion I’m supposed to draw from this slide. Now I’m listening to you to tell me why. Nice.
3) Seriously. Less Text. If someone is reading your slides they’re not paying attention to you, the presenter. Minimize the amount of reading that they have to do while not listening to you. I recommend trying to keep slides to 1 statement or phrase or conclusion per slide.
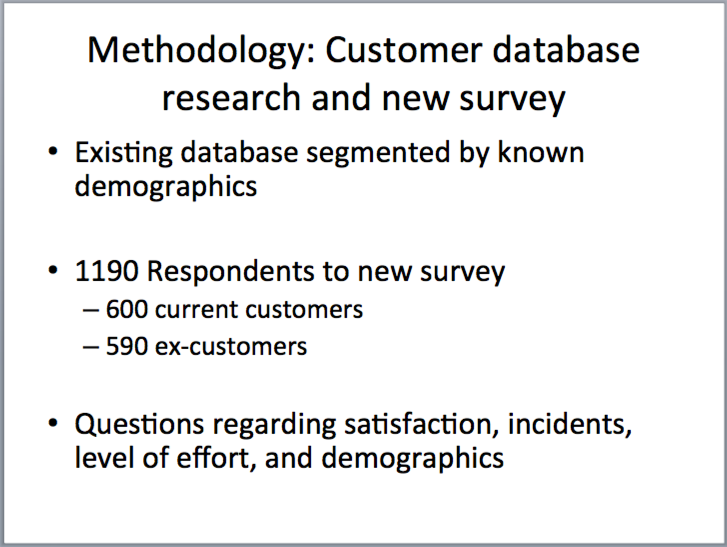
Let’s look at that methodology slide again. If you have to include it, because your audience is interested, could you make it less of a giant block of text? Try to reduce this slide to a few key ideas:
At least this time, the audience is not reading the slide the whole time.
4) Make a separate version. If your slides need to stand on their own, that’s understandable – sometimes not everyone can make the live presentation. However, the deck that you use that can stand on its own shouldn’t be the same version that you use when you’re presenting with it. By definition if it can stand on its own, you don’t need to be there and you’ve just made yourself obsolete. Yes, I know. Maintaining two separate versions of the same presentation can be a hassle, but it’s worth the trouble.
The following slides are from a presenstation that I gave recently. Forgive the bad BLUF in the second slide, but it shows how I maintained a different variation for people who missed the in-person presentation.
Verbal presentation slide.Extra slide for an email version.
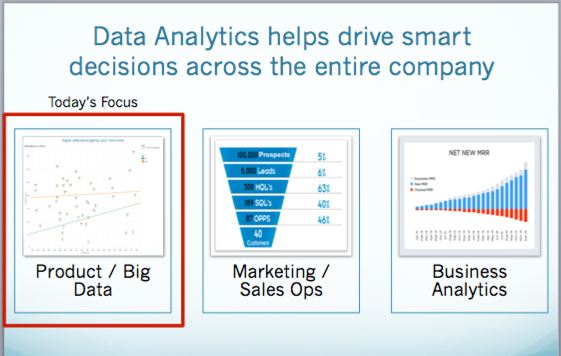
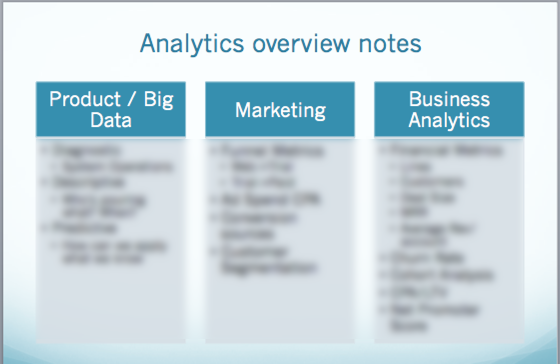
5) Make use of highlights and callouts to draw the eye. Sometimes you need to show a larger about of information on a slide in order to give context. That’s acceptable, at times, but make sure you’ve simplified it as much as possible. Once you’ve done that, use highlights, or bold, or boxes to draw attention to the important takeaway from the slide.
Look again at the slide from my presentation above. While analytics can be important across the company, this particular presentation was focused on Product Analytics. I wanted to call out the fact that going forward in the presentation, we were focused on that area.
If you keep these 5 things in mind, it’ll help keep your audience engaged with you as you take them through your data story. If you forget, you risk losing them before they get the whole story, and you can’t get your point across.
For some more detailed reading, Avinash Kaushik’s Storytelling with Data article is also a terrific read!
What’s it like working at a startup? My answer – it’s a roller coaster. Sometimes it’s amazing. Sometimes, it sucks.
If you think that a startup is where you want to work (or even moreso, if you think you want to found one) I hope you’re ready. Things in the business change day to day or even hour to hour that make it feel like a crazy ride. There’s really no comparison to anything from a typical full-time job that I’ve ever had. You have to be emotionally ready for a sequence of events like the following:
Monday: Big client proposal goes out, you’re pretty sure you’re going to get it. A few deals like this, and everyone’s gonna be rich!
Tuesday: 75% of installed clients experience unrelated issues. Fire drills take up the entire day. God, how can you possibly support a client like the one above?? Serious doubts.
Wednesday: Huge trial expansion with another customer – you expect usage to go up 10x that day and prove to them that you can handle a 10x expansion of usage, commitment, and contract value all the time. You know you’re ready for it. This is going to be awesome. Some members of the cs team work extremely late to make sure everything goes well.
Thursday: You check on results from yesterday’s trial rollout – usage went up 2x, not 10x. I mean, that’s still good right? It wasn’t really our fault, there were outside factors that limited usage! That is kind of disappointing – I wonder what it means for the fulltime expansion.
Friday: The client from Monday still hasn’t gotten back to you – you know the sales cycle is long, but you expected a response by now, you follow up, and continue not to hear anything. Back to the grind of trying to grab the small deals in order to keep your growth rate somewhere respectable.
Monday: The expansion trial customer from Wednesday lets you know that they were impressed with the 2x increase, and they want to go with the full rollout. Verbal commitment for a long term lock-in. This is super exciting!
4 Weeks Later: That verbal commit still hasn’t gotten written down, but it still feels promising.
This sequence is based off of one of the crazier recent weeks at Sestra, but really, it’s like this to some degree or another almost all the time. You know yourself better than anyone else does. Is this intimidating? Exciting? It’s important that you allow yourself to be motivated by the excitement – when it’s easy to keep pushing, and not disappointed too much by the downturns – when it can be really tough to push through. Lev likes to say that one of the things that has made him a successful entrepreneur is that his emotions cycle opposite to most people. When things are rolling well and everything feels like it’s going right, he relaxes a little instead of getting carried away in the excitement, and then when things take a turn the other way, it isn’t demoralizing; it’s just reason to dive in and work even harder to get things right.
This emotional roller coaster is wild enough having only experienced it on the employee side – most founders that I’ve talked to tend to shield their employees from much of the downsides, so it’s clear that for them, the ride is even crazier. Personally, I draw energy from the crazy ride, and if things are too smooth, I risk getting bored. It’s really important to be honest with yourself and talk through with your family whether this type of work lifestyle and risk is the right one for you. Working at a startup can be invigorating and rewarding, both from a career growth perspective, or financially, but those benefits are only worth it if you enjoy the wild ride.
Not every contract you have is going to go perfectly – even if you deliver what you promised. In August, I had my first freelance contract that I consider a failure. The client ended work early, and wasn’t satisfied. I’ve spent a while reflecting to see what I can learn from the experience.
Goal: Increase Marketplace Subs
What’s a little bit crazy is that the contract was to generate additional submissions to the marketplace on their website. My proposal indicated that my goal was to increase legitimate submissions by 50-100%. We did so, and were only 75% of the way through the contract. Ideally, it could have increased even further, but I’m not certain. One of the variations was performing 100% better than the others, so potentially with that variation running for all traffic you’d get an additional 50-75% bump. The stretch goal would have been a 400% increase (we’re dealing with small numbers here, so it was plausible), but we hit numbers that the contract said we’d hit.
Problem: Junk Subs
The problem, though, was that it also increased the number of “junk” submissions to the marketplace by 400%. To me, that was a reasonable tradeoff and strategy, but to them it meant that they had to dedicate time and energy to dealing with the junk. We didn’t spend enough time thinking through what would happen, and who was going to handle the additional workload: I probably could have saved it if I had been willing/able to communicate with them in real time and deal with the junk automatically instead of leaving them to deal with it. I knew that it was going to happen, but letting them try to handle it themselves was likely a misstep on my part – and if I could have I would have much preferred to just handle that manual work with inexpensive interns, or automation, but they seemingly don’t feel like they’re in a place yet that they can afford not to handle each one with expensive, knowledgeable communication.
Reflection: Manage Risk expectations along with the upside
In any case, that scenario ended with a mildly unhappy client, and certainly no great referral or goodwill for me. It was a learning experience in terms of expectation management, though. It was my first contract, so I think that I just didn’t do particularly well setting expectations and interacting with them like I did with others.
Communication note: Getting added to the slack team with some of my other clients has been by far the best way to stay in touch. It makes you feel MUCH more like part of the team. I know that with the couple long term contractors I have hired, the ones that felt like that stuck around a lot longer and had a much better relationship. Looking at my experience so far, the ones where I have done that, I’m successful and the ones where I haven’t were not. It’s a pretty stark comparison, actually. In addition, I’m not doing a ton of consulting anymore, but the relationships that I built with some of my clients are good enough that I continue chatting with them.
I discussed my analytics philosophy in Part 1. In order to follow along, let’s work through connecting all of your data sources together.
First, the two sources nearly everyone reading will have: user-tracking analytics, and a production database. Today I’m going to discuss how we’re handling this at OneMonth. The core of the heavy lifting is handled by Segment, Fivetran, and Zapier.
Unlock your data
In many cases, user tracking data is locked inside Kissmetrics, Mixpanel, or google analytics. I’m sure that I’m not the only analytics guy who has looked at Mixpanel, and thought to myself, if only I had access to this raw event stream, I could do something way more insightful! Luckily for me, One Month was already using a rock solid Segment.com integration to send these user events all over the place, and segment is the key here.
I mentioned segment.com as the one tool to rule them all, and I think they’re doing a really amazing job simplifying the event-tracking side of analytics. One of their great new-ish features they call segment SQL. Because segment doesn’t really care where your data goes, they want you to have as much access to it as possible – unlike MP, KM, or GA who have a vested interest in keeping you locked into their particular platform (sorry guys, you know I like you, but this is a huge annoyance). This led them to enable access to the raw event data IN AMAZON REDSHIFT. Boom. Now, we have query-access to the raw event stream. In my experience this is by FAR the most straightforward and scalable way to have access to your user events.
The segment business plan that enables this is relatively expensive, but it’s the easiest path. That said, they also just released Segment Warehouses last week in order to enable less expensive options to the raw data that require less overhead on their side (and conceivably could enable better data security), but will require some internal dev time on your side to maintain. For One Month, the convenience factor won the day, but your mileage may vary.
Check out Segment Warehouses
Next, I had planned to use Zapier and some custom code in order to connect the production database, zendesk, stripe, surveys, and hubspot to the redshift database. I’m particularly excited to see the effect of customer success teams – and zendesk data – on onboarding and paid conversion rates. CS teams can be a big competitive advantage, and being able to prove their value could cement their place.
Data-pipeline-as-a-service
However, even as we work on these types of projects, new tools are coming out. Data-pipeline-as-a-service is a new niche that several companies are spinning up solutions for. Some names here are RJMetrics and Fivetran. For OneMonth, we chose Fivetran. They were suggested to us by the chart.io guys during a demo, and it’s a pretty slick tool. Instead of having to come up with a schema and write up the zap for each event, they automated all of that interaction and made it pretty close to a one click setup to send everything to redshift. They’re still in a very early stage, so one of our integrations had some bugs, but they had everything straightened out within 24 hours.
Once they did, zendesk, stripe, and hubspot were auto-magically populated into our segmentSQL redshift instance. This saved me a bunch of setup time, and also populated all of the fields. If I had to write up the schema myself, I was going to only take what I considered to be the most important fields, but now, I get everything. Plus, we’re excited that someone else will be managing those interactions. One Month runs quite light on developers, so offloading management to third party tools is an obvious win. In the time since I wrote the draft until publication, Fivetran has more than doubled the number of sources that they integrate with. Nice job guys – keep up the good work.
I also don’t want to leave Zapier out of this party – I did end up using them for our survey data. The answers already lived in a master google doc, and it’s a spreadsheet. Sending that data one line at time via zaps to redshift was quite straightforward. There will likely continue to be use cases where their simple app-to-app integrations are the best solution.
So, what did all of this buy us? In short, all of our data sources live in the same place and can be queried against each other. Mixpanel alone offers you the opportunity use funnels to ask “what % of people took action A, then action B, then action C?” That’s great, but it gives no context around the time intervals between events. Someone who took 24 hours to get all the way to Action C is a completely different type of user than someone who completed A, then B a week later, then C a week after that. One of my first data new visuals will be the time distributions of these event funnels.
Add a splash of history
But wait, there’s more! I know there are hack-y ways to adhoc this type of analysis, but since it’s in SQL, we can mix in a bunch of other data sources like the historical survey data where we define customer personas, and stripe! Does a certain type of person gorge on content while others consume at a more leisurely pace? Does that distribution change for people on a cheap plan versus an expensive plan? What impact does the type of distribution have on lifetime customer value? These are all ridiculously important questions that can have a material impact on your marketing, persona targets, and goals for your users.
Without Segment SQL and a data warehouse, we’re stuck with “X% of users completed action B”, but with it, we can learn so much more. Best of luck connecting all of your data sources! Check back for the discussion of visualization tools to best analyze your new data warehouse, and a sample of some things we did at OneMonth.
In the startup analytics world, I’m sure you’re familiar with the following situation: you’ve got billing systems, product databases, event tracking, surveys, churn prevention software, sales, customer service interactions, and uncountably more systems. SOMETHING that you’re doing is getting these customers to pay, and to become loyal, but what is it? This is where you need to start using advanced analytics and potentially a legitimate data warehouse (but that doesn’t need to be scary!).
I’m realizing that even after just a few weeks of consulting, I’m answering the same few questions multiple times for different people at different companies. Specifically, post-initial traction size companies (generously, 750k or $1M in annual revenue). Oftentimes, this size company has had some small amount of dedication to data, but more often than not, it’s incomplete. At smaller sizes, you may not really have a big enough sample size to justify a thorough effort around data – if a 10% difference is just a few people, does it matter if you’re dropping that much data? However, around $1M, you probably have enough steady paying users to make a 10% data loss start to be particularly meaningful, and you also probably have enough data sources to postulate questions that you know you could answer – if only all the data sources talked to each other.
Philosophically, I think that the lean startup methodology can work at the expense of analytics. When something in the product is broken, you’re not going to push it to production, but how many startups will block a push because the tracking isn’t quite right? They must exist, but I haven’t worked at any. For this reason, I always want to start with the data sources that I trust the most: the product database. In SaaS, there will almost always be a lot of valuable information stored in a database somewhere. Manipulated effectively, this database is likely to have a lot of insight into what core actions a user is taking on your site. You may lose some granularity around where or how a user accomplished a task (depending on how complicated your app is), but stuff that gets stored by the product database is inherently high-impact. For the conference call company, it’s users, phone calls, team members; for the online education company it’s courses taken, courses completed; for the form digitization company it’s forms converted, submissions made, active users, etc.
Not only is it the most likely to be accurate, but if it’s broken or has missing data, the developers will probably notice, and be willing to fix it, no matter who noticed. Occasionally, you’ll be the one to find a bug, but it’ll be a high priority fix. When I do an analytics implementation or deep dive, this is where I look to start.
Access to a copy of the production databases is a critical place to start in most cases. However, that’s generally a pretty easy step. This data already lives in a database and making an “analytics copy” where your analysts won’t mess up production data is quite straightforward.
What will follow over Part 2 and Part 3 is a case study of an implementation of a new analytics setup that I hope will encourage other companies to do what they can to enable better decision-making from top to bottom.
If you’ll enjoy following along with this journey, be sure to sign up for the newsletter so that you’ll know as each part of the story comes out!
Stepping out of your comfort zone is a huge cliche, but it’s also an incredibly important part of being a successful entrepreneur.
I occasionally reflect back on my time in UVA’s MS Comm program. I always think back fondly on the friendships I made and the work that I did, but as with all academia, the translation to the real world can be hit or miss. Today I want to talk about the single lesson that, when I look back, carried more weight than any other class time we ever spent.
The $20 Challenge
It was someone’s guest lecture (I don’t even remember which lecturer, which is mildly embarrassing, but maybe one of my professors will see this post and let me know). He was talking about being an entrepreneur and the type of personality it takes to be successful. Then he put a $20 bill down on the table and said “Who wants it? Come take it.” Of course, everyone in the room looks around with expressions that say “Is he serious?” Well, he was serious, and we all hesitated.
In order to be the one who takes it, you have to be ok being a little bit uncomfortable, a little bit shameless. People are going to judge you for being “that guy” who actually took it. I know that at the time, I stayed in my seat – though I’d like to think that now, I’d be all over it.
Take the Money, or you’re not ready
Eventually, one student did go up and get it, but even he, who generally was a little bit shameless, still announced as he sat down that he’ll use it for a round of drinks for the rest of us at the bar. That statement was simply an effort to move back into the comfort zone, and hope that the crowd doesn’t judge you too harshly. As much as anything else, this tells you why our entire class had some lessons to learn before we started up a business. In order to succeed, it’s likely you’re going to have to step out of your comfort zone, and even when you decide you’ll do it, you have to do it quicker than everyone else.
There’s not much room for hesitation when you’re trying to do something amazing.
The lessons from that class, among other things, are encouraging me to step out of my comfort zone, but I’m not there yet. It still makes me incredibly self-conscious to take some of the advice from stuff like The Charisma Myth.
Strike up a conversation with a stranger
Here’s one of the author’s examples of how to stretch yourself and your charisma, and to practice being uncomfortable:
“Strike up a conversation with a complete stranger. For instance, as you wait in line at a coffee shop, comment on the pastries and then ask your neighbor an open-ended question, such as: “I’m trying to decide which is the most sinful: the muffin, the brownie, or the cake. How would you rank them?”
― Olivia Fox Cabane, The Charisma Myth: How Anyone Can Master the Art and Science of Personal Magnetism
I’ve done it – once. And boy was it uncomfortable. I know I still have a long way to go before I’m ready to take full advantage of opportunities, but I’m working on getting better! There are other examples, from Cabane, Tim Ferriss, and others. Ferriss’s are typically more amusing:
Relax in Public
Simply lie down in the middle of a crowded public place at some point. Lunchtime is ideal. It can be a well trafficked sidewalk, the middle of a popular Starbucks, or a popular bar. There is no real technique. Just lie down and remain silent on the ground for 10 seconds. Then get up and continue with what you were doing. Don’t explain it at all. If someone asks you about it, just say that you felt laying down for a little bit.
He has others, but you get the picture. There’s nothing wrong with this, but goodness people are going to think you’re odd. I still haven’t worked up the courage? guts? craziness? to do this particular one, but it’s always in the back of my mind for whenever I decide to go all in. For me it’ll be a good chance to know when I’m ready to start up something on my own.
Who knows where this type of self improvement will take me in the long run, but it’s going to be a fun ride.
When’s the last time you stepped out of your comfort zone?
The conventional wisdom when you’re building a tech startup is that you “have” to move to San Francisco. It’s absolutely the case that the investor pool is easier to meet, local talent is easier to come by, and it’s easy to network. However, I think some of the diversity problems that arise in early tech startups are due in large part to this philosophy. Only certain personality types are going to be willing to move, live, and work in San Fran. There’s a crazy absolute volume of talent elsewhere in the country who can’t or won’t move there. Being able to tap into this pool through distributed teams should allow companies to recruit exceptional people, and maintain a considerably move diverse culture.
It’s worth acknowledging that you certainly miss out on some team camaraderie type things by being full time remote, but I would argue that you can build in retreats and other ways to develop a fun, passionate company culture without requiring everyone in person. It’s also true that there are some tasks which are just better done in person. In my own remote work, I definitely miss the ability to sit in a room with a white board. That said, web tools are getting close. We’re not QUITE there yet with a seamless virtual presence, but it’s getting close. Plus, when the whole team is remote, the whole team invests in tools to be successful. As these tools get better and better, remote teams are only going to continue to be more effective. So, when we’re looking towards the future, I think that investing in the infrastructure and culture to make these types of teams work is going to pay back 10x over the next 10 years.
As an aside, when you do a half-remote thing, there’s a humongous risk of the remote people getting left out (I know that happened in my last role). You can make half remote concepts work, but I would argue that it might be even more challenging to do so successfully than an all-remote team. It’s a big struggle to get the local people to use the remote tools, and then when there’s a meeting with 4 people in a room and 2 remote, it’s easy for the people not there in person to just get run over. When everyone’s remote, you don’t have these kinds of worries.
I personally love the concept of sqwiggle. I know that it freaks some people out, or feels like big brother, but as long as you’ve established that your team and boss isn’t using it to check your hours (especially because on a remote team, our hours probably don’t overlap for much of the day), it can absolutely enable better communication between teammates. It would also be a fun integration with Saent where you could have the software connected to the timer overlay a person’s icon on sqwiggle so that the whole team could know when you’re in a focus sprint and not bother you.
Getting a team to respect those type of sprint boundaries is obviously its own challenge, but I think it’s something that could be particularly effective. There’s no great queue for “I’m busy” on a remote team, because people are generally not great about updating chat client statuses. I know that when I go on DnD, I’m hugely unlikely to remember to flip it back when I’m done. Integration with Saent would help in that regard.
It’s going to be an interesting world to live in. Steve Case and co. already talk about the Rise of the Rest, but that’s still about building teams in local communities. It’s not the same thing as spreading out your team in order to find the best, most passionate, most invested people no matter where they are. Saent’s trying to figure out how to navigate a lot of the issues related to pay and equity and culture when the whole team’s remote, but I think that it’s going to come out as a much stronger company because of the effort put in up front to enable this structure to work. Should be fun!
The impact of A/B testing is created along 2 dimensions, potential impact of any experiment X number of experiments run. In the early days, you’re potentially a team of one, and there are limits on the amount of things that you can test. Once you move a little bit into the process side of the world, you can operate on Sean Ellis’ idea of High Tempo Testing. I know I want to test different ad copy, different landing pages, different imagery. All of these are good to do, and they can absolutely result in positive gains. Plus, the upside to all of this type of testing is that you can do it yourself.
Early on at a startup, oftentimes, a 10% gain might only result in 1 extra lead, or 1 extra sale. While, it’s clear that over time, these incremental improvements can add up, they’re really most effective from a large base. You need to do things that can have 50%, 100%, 200%, 500%+ improvements over the status quo, and I’ll bet you that’s not a different landing page image.
To illustrate these big picture items, I want to walk through 3 huge tests that I ran with Speek. We were not great at maintaining tempo of testing, but we were good at looking for high impact experiments.
1) Self-serve or Inbound Sales Team.
After a major site redesign, Speek was able to handle self-signup teams (our MVP required a salesperson to setup a team in the system). Once we did that, we needed to decide whether self-signups were optimally left alone with an automated on-boarding and drip or an inbound market response rep (MRR) and sales process. For two weeks we ran half of the leads through our best MRR. The results here were overwhelmingly positive for the sales team. In that first month, 90% of the closed seats came through the leads that were answered by an MRR. So, we went quickly with that side of the test.
It’s worth noting here that over time, the self serve leads did close a few more, but both the sales cycle time and and close rate were much higher. Obviously the salaries to the MRR and the Account Executive represent a significant cost, but for us, with top-line revenue growth as the key metric, the acceleration of cycle time and deal size made it a no-brainer.
2) Credit Card Before Trial or After.
Now sometimes your tests won’t work, and that’s fine. Frankly, it’s part of why you need the ones that do work to work really well. After a conversation with Joel Holland (Founder of Videoblocks), I learned that their cashflow went up 10x and revenue went up 4x when they started requiring a credit card up front for their free trials. They’re a B2C product, with a self signup model, unlike ours, but really, that type of potential swing in your business is something that you can’t pass up the opportunity to experiment with. For Speek, it didn’t work -> trials went down roughly 75% for the CC up front group, which left the inbound sales rep twiddling his thumb a bit too much. Even with a slightly higher conversion rate, it couldn’t make up for the drop in top end. Lesson Learned.
3) Pick between outbound sales tactics.
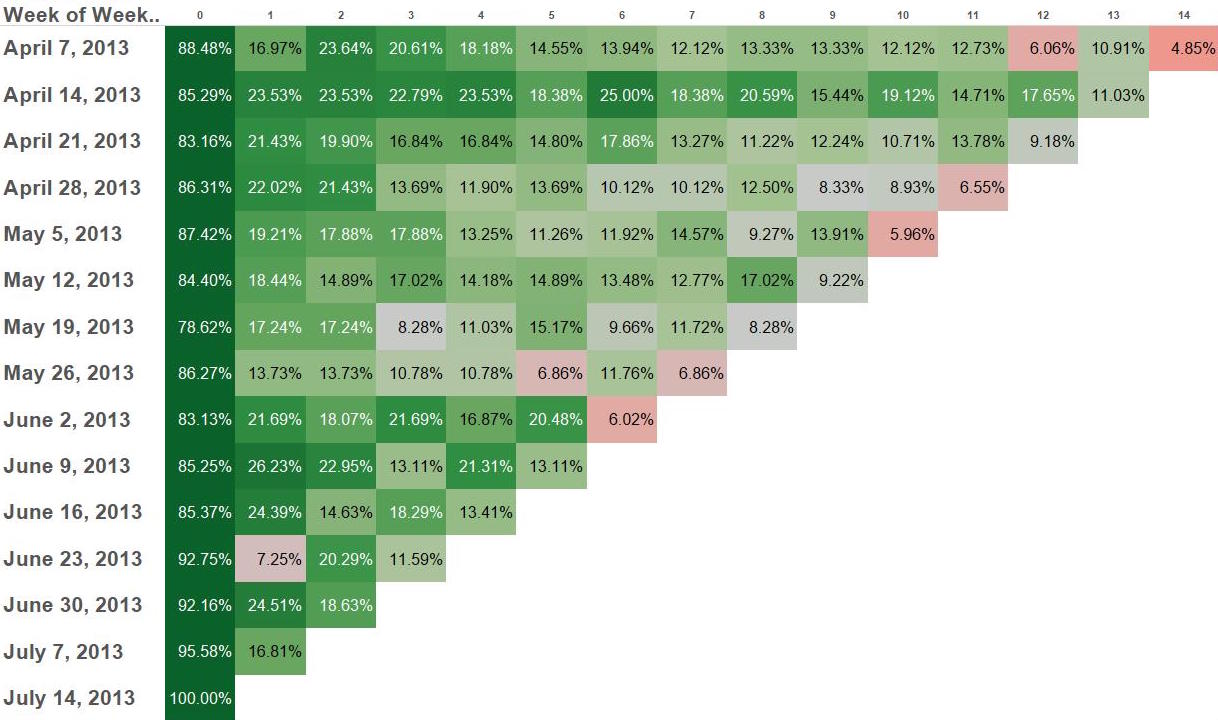
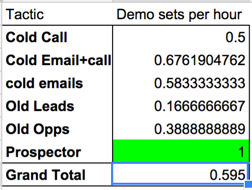
One of the most non-standard experiments we ran was all about testing time efficiency. One of the most valuable resources in the company was the time spent on any particular project or tactic by our lead SDR. It was almost possible to project future revenue based on his productivity from the prior month. So, making his time more efficient was critical. What tactics work best? What lead lists work best? The only way to really know is by running an experiment. Check out these results after 3 weeks:
What each tactic represents isn’t super important (other than the shoutout to the guys at SalesLoft) but look at those results. After 3 weeks, we could see that one tactic in particular – and luckily a scalable one – is almost 50% more effective than any other.
When you’re looking at experiments early on at a startup, when you have limited time, limited resources, and too much to do, just make sure that you focus your efforts on experiments with the potential for a big win.